


XRD Data Analysis Explained Step-by-Step | Complete Tutorial for Beginners to Experts
Welcome to The BlogRR, your trusted platform for in-depth scientific and technical tutorials.
This article presents a comprehensive, step-by-step guide to X-Ray Diffraction (XRD) Data Analysis, designed for students, researchers, and professionals in the fields of materials science and crystallography.
The tutorial explains how to download, install, and effectively use essential software tools such as HighScore Plus, Crystallography Database, and OriginPro Lab to perform accurate XRD data interpretation — from raw data import to the creation of publication-ready graphs.
Introduction to XRD Data Analysis
X-Ray Diffraction (XRD) is a fundamental analytical technique used to determine the crystalline structure and phase composition of materials. Through XRD, researchers can identify compounds, assess crystallinity, and investigate the structural properties of solids.
Accurate data analysis ensures that diffraction patterns are interpreted correctly, enabling reliable material characterization and reproducible scientific outcomes.
Software Requirements
For this tutorial, the following software tools are used:
- HighScore X’Pert Plus – for phase identification, pattern treatment, and reference matching
- Crystallography Open Database (COD) – for integrating reference patterns
- OriginPro Lab – for data visualization, smoothing, and graph design
Each of these tools plays a key role in transforming raw XRD data into meaningful analytical results.
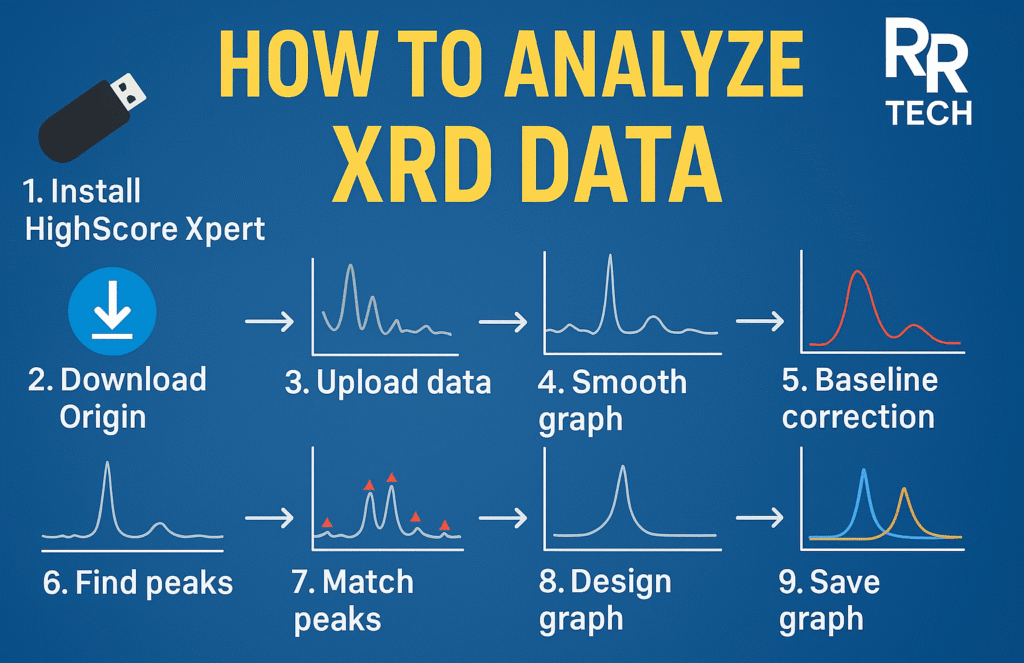
Step-by-Step Workflow for XRD Data Analysis
1. Introduction to XRD Analysis
Overview of the purpose, principles, and applications of XRD in material science.
2. Software Installation and Setup
- Download and install HighScore X’Pert Plus.
- Obtain and integrate the Crystallography Database (COD or ICDD).
- Install OriginPro Lab for advanced data processing and visualization.
This setup enables seamless coordination between data analysis and reference matching.
3. Importing XRD Data
Import the raw XRD data file (e.g., .xy or .dat) into OriginPro Lab.
Ensure that the data is properly formatted and scaled before analysis.
4. Graph Smoothing
Apply data smoothening techniques such as the Savitzky–Golay filter to remove noise while retaining peak information.
This step improves the readability and interpretability of diffraction peaks.
5. Baseline Correction
Perform baseline correction to remove background intensity.
A corrected baseline ensures that peak intensities accurately represent the crystalline phases.
6. Absolute Value Calculation
Normalize and adjust the intensity values to ensure uniformity and comparability between samples.
7. Graph Design and Formatting
Customize your graph using OriginPro Lab to make it visually clear and professionally formatted.
Adjust axis labels, font sizes, line thickness, and include sample identifiers and legends for clarity.
8. Exporting Publication-Ready Graphs
Export the finalized graph in high resolution (TIFF, PNG, or PDF) for inclusion in research papers, reports, or academic presentations.
9. Peak Analysis in OriginPro
Use OriginPro’s Peak Analysis module to detect and label major peaks, measure 2θ values, and calculate relative intensities.
This analysis provides critical structural insights and supports phase identification.
10. Data Upload in HighScore Plus
Import the processed data into HighScore Plus to initiate phase identification and reference matching.
11. Data Treatment and Refinement
Use HighScore Plus tools to treat and refine the dataset, ensuring that background subtraction, smoothing, and calibration are properly applied.
12. Peak Searching and Matching
Perform automatic peak searching, then match identified peaks with reference patterns from the Crystallography Open Database (COD) to determine possible material phases.
13. Exporting Reference and Miller Indices
Export matched references and assign Miller indices (hkl) to each identified peak.
Miller indices provide detailed crystallographic information about each reflection.
14. Representing Miller Indices on Graphs
Display Miller indices on the graph using OriginPro Lab for a scientifically accurate and publication-ready presentation.
15. Stacking of Graphs
Overlay or stack multiple XRD patterns (for instance, before and after treatment) to analyze phase transformations and compare material behavior.
Key Learning Outcomes
By following this tutorial, readers will learn how to:
- Process and analyze XRD data effectively and accurately
- Apply baseline correction and smoothing techniques
- Identify diffraction peaks and assign Miller indices
- Integrate crystallography databases for phase identification
- Create professional, publication-ready graphs
Importance of Accurate XRD Analysis
Accurate XRD analysis is essential for:
- Determining the structural and phase composition of materials
- Detecting impurities or mixed crystalline phases
- Evaluating treatment effects on material structure
- Producing reliable and reproducible research outcomes
A precise analytical workflow enhances the credibility and quality of scientific publications.
Video Chapters
For a detailed visual explanation, the corresponding video tutorial follows the timeline below:
- 00:00 – Introduction of Channel
- 00:20 – Introduction of Topic and Overview
- 01:05 – Download HighScore X’Pert Software
- 02:26 – Download Crystallography Database
- 02:41 – Add Database into HighScore Plus
- 03:28 – Download OriginPro Lab Software
- 05:12 – Import XRD Data into OriginPro Lab
- 07:33 – Smoothening of the Graph
- 11:56 – Baseline Correction
- 13:18 – Absolute Value Calculation
- 14:23 – Designing the Graph
- 20:23 – Exporting the Graph
- 23:10 – When Smoothening or Baseline Correction Is Not Needed
- 27:49 – Peak Analysis in OriginPro
- 31:20 – Upload Data in HighScore Plus
- 33:08 – Treatment in HighScore Plus
- 33:28 – Search Peaks in HighScore Plus
- 34:09 – Search and Match of Peaks
- 38:00 – Export Reference from HighScore Plus
- 40:20 – Miller Indices and Reference
- 41:40 – Miller Indices Representation on the Graph
- 46:16 – Stacking of Graphs
Tools Summary
| Software | Purpose |
|---|---|
| HighScore X’Pert Plus | Phase identification and database matching |
| Crystallography Database (COD) | Reference pattern integration |
| OriginPro Lab | Graph processing and data visualization |
Conclusion
XRD data analysis is an indispensable process in materials science and crystallography. By mastering the workflow outlined above, researchers can confidently transform raw diffraction data into accurate, interpretable, and publication-quality results.
At The BlogRR, our objective is to deliver clear, practical, and scientifically precise blogs that empower researchers and students to excel in their experimental and analytical work.